SolarSoiled · Program
We find rooftop solar in aerial photographs and work out what dirt is costing it
Dust and pollen settle on solar panels and cut how much power they make. Almost no owner ever finds out how much, because the people with the answer are usually the people selling the wash. We measured it for every solar roof in Santa Cruz County and put the results online for free. Rain here does most of the washing, so for the dirt we can measure, paying for a cleaning costs more than it saves on every roof we looked at.

Live today
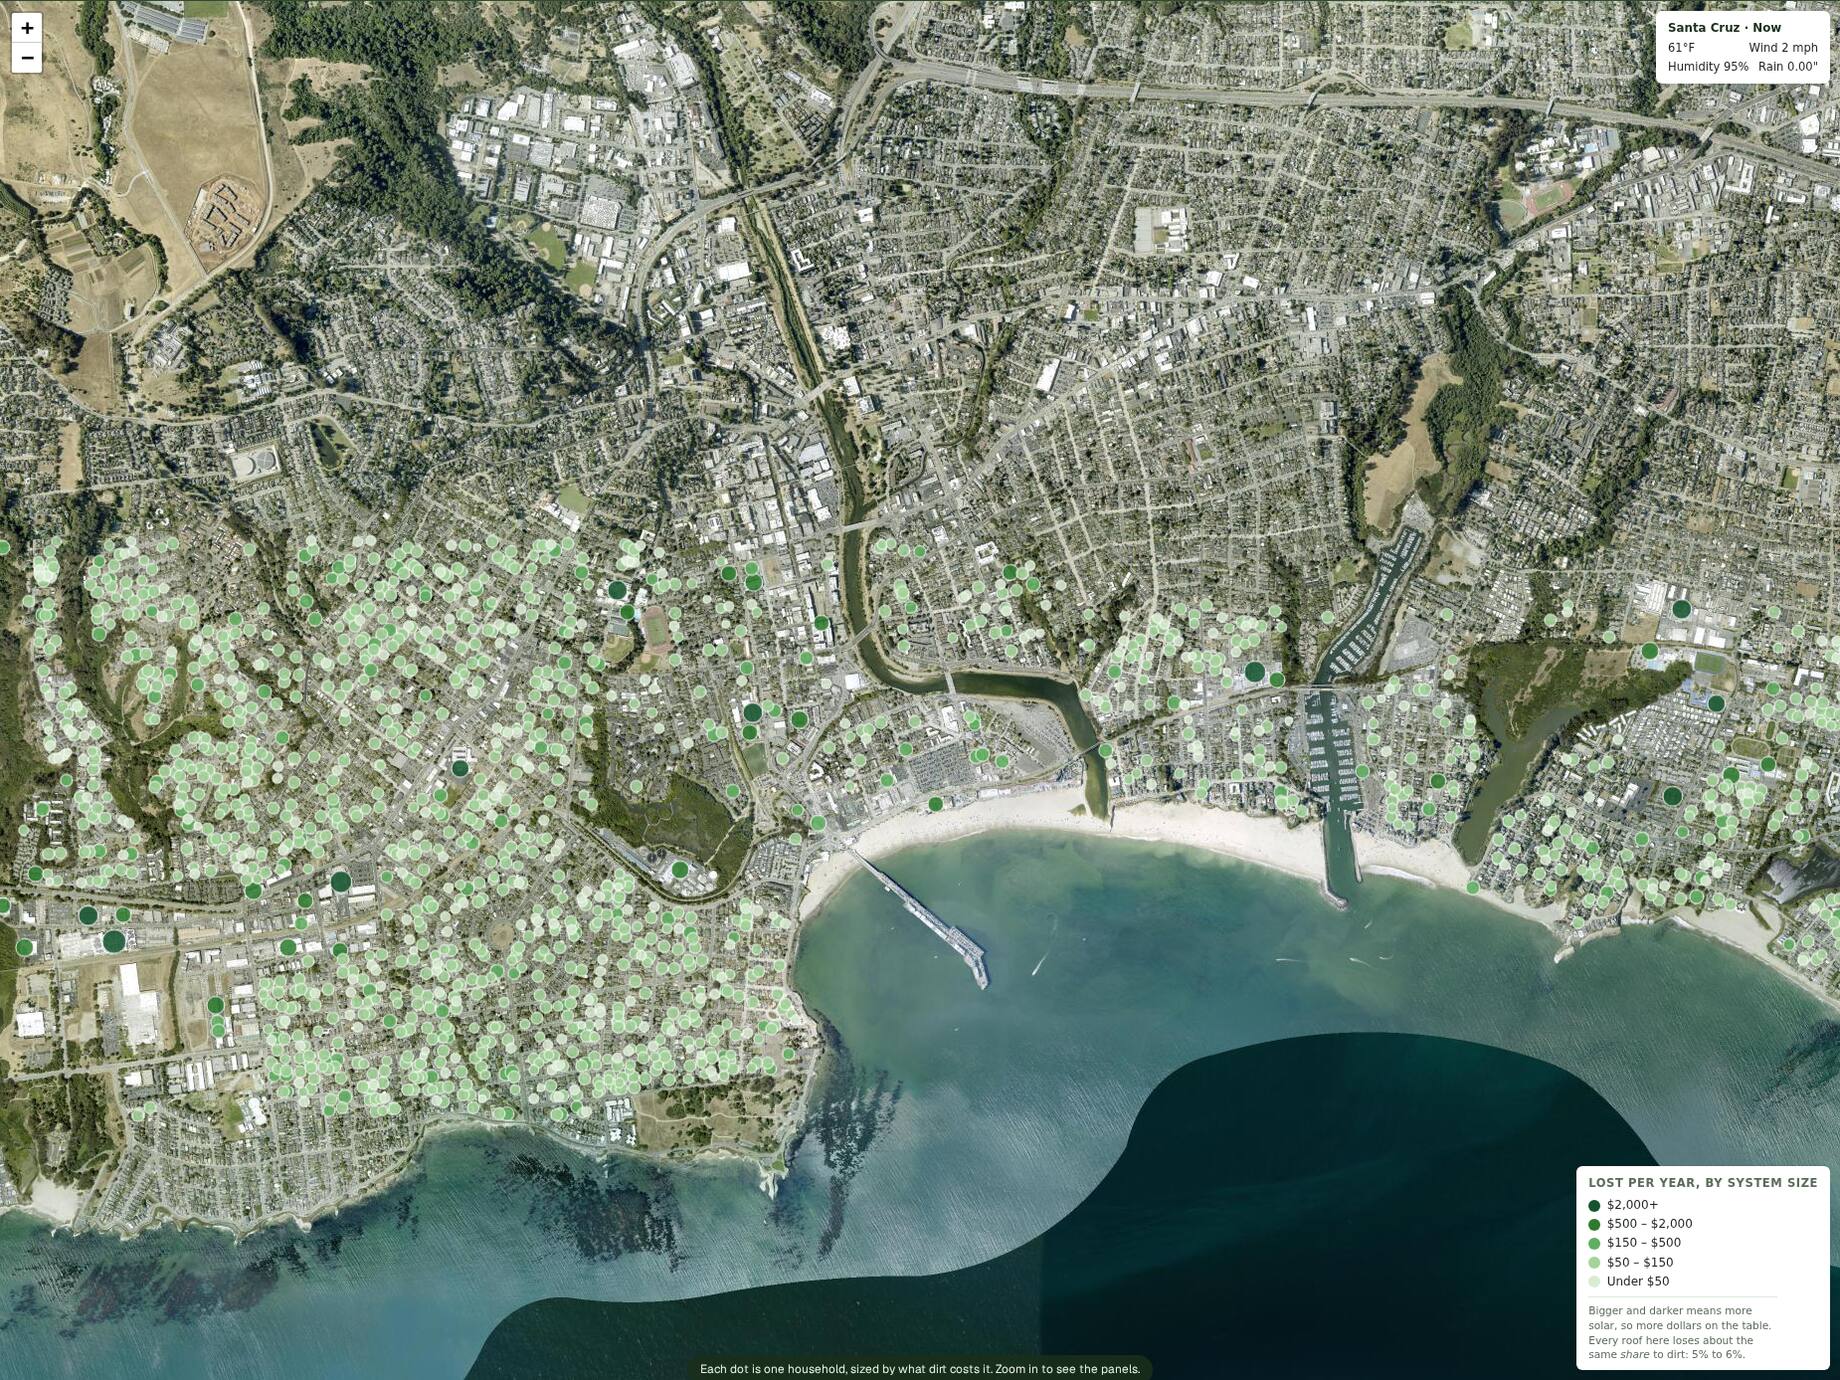
households with rooftop solar, detected and priced across Santa Cruz County, California. Free to explore, no account, no signup.
3,362 separate arrays, because a single system is often several panel groups on one roof.
Roof shapes are public. The people under them are not.
The published dataset carries roof geometry, soiling scores, and household system totals and nothing else: no addresses, no owner names, no parcel numbers. A check in our build refuses to publish the site if anything address-shaped turns up in it.
We could publish addresses. We had them. A tool for helping people with their own roofs should not double as a list of who owns solar.
How it works
From an aerial photograph to a dollar figure, in four steps
Nobody visits the house and nobody logs into a utility account. Everything below runs on photographs and weather records that are already public.
Start with a photograph
Santa Cruz County flies its own aerial survey and publishes the imagery. Each pixel covers 21 cm of ground, so a solar panel is about eight pixels across: enough to make out the shape of an array, not enough to make out a person.
Trace the panels
A model trained on hand-labelled rooftops draws an outline around every group of panels it can find, and reports how much roof each one covers in square metres. That outline is the only thing measured directly from your house.
Turn area into kilowatts
Modern panels produce about 220 watts per square metre of glass, and roughly 84% of an outlined array is glass rather than frames and gaps. That works out to 5.41 square metres per kilowatt, a ratio we checked against 130 local building permits where the installed size is on record.
Price the dirt
Local weather and air-quality records say how much dust settles between rains and how much output that costs. Multiply the lost kilowatt-hours by what a kilowatt-hour is worth to that household and you have dollars a year. In Santa Cruz the answer runs from $9 for the smallest system to about $23,300 for the largest.
Does the detection work?
F1, the standard score that balances arrays missed against things wrongly called an array. It found 80% of the arrays that were really there. Confidence interval 0.798 to 0.853, against a pass mark of 0.75.
We set the pass mark at 0.75 and wrote it down before running the model. The score comes from photographs the model had never seen, at settings chosen on a separate batch and then locked, so the result is not tuned to the test it reports.
What scale looks like
One county is done. At least thirteen more publish photographs just as sharp.
Nothing in the software is specific to Santa Cruz. It is simply where we started: the county flies its own aerial survey at 21 cm, and at least thirteen other US counties publish surveys about that sharp. We have not acquired them. Each one means licensing the imagery, retraining the detector on it, and redoing the validation before we would put a number on anybody’s roof. That is the work, and it is the thing support pays for.
Covering the whole country is a different constraint, and there it really is the photographs. The imagery that reaches everywhere is coarser than a county survey, and below a certain pixel size a panel stops being a shape and becomes a smudge. The two national figures below are how many US rooftop panels each level of imagery would put in reach, not how accurate we would be.
Today
Santa Cruz County, 21 cm
1,865 households
Live, free, and public, at a measured 0.826 F1, with tools anyone can open in a browser.
Next
60 cm imagery, nationwide
~50% of US rooftop panels
Aerial photography at this resolution covers the whole country, and the pipeline already runs on it. Carrying today's accuracy across is retraining and validation work rather than new research.
With support
30 cm imagery or better
75%+ of US rooftop panels
Sharper photographs show which way a panel faces and how steeply it sits, and they would show how much tree canopy sits over an array, which is the first thing we have that might separate one roof from its neighbour.
What we measured
A cleaning gets back less than we thought
Our tools used to assume a wash recovers most of a year's soiling loss. When we ran the local rain record through the model, one wash bought about two weeks of clean glass before the panels were back where they started. Rain does the same job for free on roughly 27 days a year here. So a wash recovers about 4.5% of the annual loss, and at that rate none of the 1,865 households in the pilot gets back what a $90 cleaning costs. We rebuilt the tools around the corrected number. That holds for the dirt rain removes, which is the only kind anyone has measured here.
Paying to wash panels here is a bit like paying for a car wash the day before a storm. The dirt really does cost you money over the year. What a wash buys is two weeks of clean glass that the weather hands out for free anyway.
What the model can and cannot tell you
It cannot tell you that your roof is dirtier than your neighbour’s. Dirt is estimated from weather records, and one weather station covers the whole county. Of the 1,865 households we mapped, more than nine in ten land between 5.0% and 6.0% of output lost.
It can tell you how much solar is on your roof, measured from the photograph. That is what decides whether the loss is $40 a year or $4,000.
Where the accuracy goes
The next thing to measure is the roof itself
To tell one roof from another we need something that varies between them. Two candidates: how much tree canopy sits directly over the panels, which sharper imagery would show, and what output a household actually recovers after a real cleaning, which owners could report back. That second one would also settle how much grime rain leaves behind, the one input that could turn our advice around on an older array. Both are planned. Neither is running yet.
The decisions behind it
Six questions we get, answered
- Why did the array count go from 334 to 3,362 without covering more ground?
- Same county, same rooftops, sharper photographs. The first pass used 60 cm imagery, where a whole system reads as one blob. At 21 cm the model can see the gaps between panel groups, so one roof now comes back as several outlines: 1.8 on average, and 22 on the largest. Nothing new was surveyed. We lead with 1,865 households because that is the number of people involved.
- Why publish roof shapes but never addresses?
- We had the parcel number for every property in this dataset, and parcel numbers lead straight to owner names in public county records. Before publishing we replaced them with scrambled labels that group a roof's panels together and mean nothing on their own, and our build now refuses to ship a file containing anything address-shaped. A website is hard to un-publish. A tool for helping people with their own roofs should not double as a list of who owns solar.
- Why does the site now say not to pay for a cleaning?
- Because we measured what a cleaning recovers instead of assuming it. Two weeks of clean glass out of twelve months works out to 4.5% of the annual loss, against 90% in our old assumption. Combined with two other corrections (what a lost kilowatt-hour is actually worth to a solar home, and how much glass fits in a square metre) the old tools overstated the benefit of a wash by about 48 times. Fixing them turned every recommendation in the pilot negative. The 4.5% is what a wash gets back from dirt that rain would have taken off anyway, which is the only dirt anyone has measured here.
- Is there any dirt your model does not count?
- Yes, and it is the weakest point in the whole calculation. Everything we measure is soiling that rain washes off, because that is what the national dataset our model learns from is defined to measure: it reports what an array loses between one perfect cleaning and the next. A film that survives a wash was never in that number. Panels do pick one up, and only a wash takes it off. Nobody has measured how fast it forms in Santa Cruz, so our tools count it as zero, which is a gap in what we know rather than a result. A typical roof here would have to be losing about another 5% of its output to that film before a $90 wash paid for itself, or under 2% for a household still on a legacy retail-credit plan. Measuring it is the next thing on the list.
- Why publish a finding that shrinks your own market?
- A homeowner who reads it keeps $90. A cleaning company that reads it stops driving to jobs that lose money. Nobody who sells washes has a reason to run this calculation, and that is the sort of question a nonprofit exists to answer. It also tells us where the work is worth doing: dusty inland sites at commercial scale, which lose several times more per year to begin with and cost far less per kilowatt to wash.
- Why can you size my system but not tell me whether my roof is dirty?
- Size is measured off the photograph of your roof, so it is yours. Soiling is inferred from weather records, and the nearest weather station serves the whole county. More than nine in ten of the 1,865 households land between 5.0% and 6.0% of output lost, which is far too narrow to separate one roof from the next. So the size figure is specific and the dirt figure is a local average, and we say which is which everywhere they appear.
For cleaners and installers
Every array in a service area, with its size and what it loses
If you service solar, the expensive question is which roofs are worth driving to. We can answer half of it: where the arrays are, how big each system is, and what soiling costs that household per year. Across the pilot that annual loss runs from $9 to $23,300. The spread comes almost entirely from system size, which we measure directly off the photograph.
The other half we cannot answer. Our dirtiness scores do not separate one roof from another inside a county, so we are not going to sell you a list ranked by them. On this coast our own figures say a single wash rarely pays for itself, which is worth knowing before you buy leads from someone who leaves it out.
Where cleaning does pay
It comes down to how much there is to lose in the first place. A dusty inland array loses several times more output per year than a coastal one, so the same wash is worth more in dollars, and at commercial scale a wash costs far less per kilowatt. Those are the sites our numbers support.
What does not improve in a dry climate is the share of the year a wash buys back. We checked Phoenix and Bakersfield and got slightly lower shares than Santa Cruz, because the share is measured against an annual loss that is itself much bigger there. We have not run the full pipeline in either.
Why we give it away
Nobody was going to pay for this answer
Getting more power out of panels a household already paid for is about the cheapest carbon reduction there is. But the answer to “should I clean?” is often no, and a company whose income depends on washing panels is not the one to say so. So the calculation never gets done, and the homeowner keeps guessing.
Charging homeowners to find out what their roof is losing would put the answer back behind a paywall, so we do not. That is why the work needs funding from somewhere other than the people using it.
It is the same job as our airline sustainability ranking: take information that is technically public and practically useless, and turn it into something someone can act on.